
Cleveland Browns vs San Francisco 49ers Match Player Stats (Nov 30, 2025): Full Recap

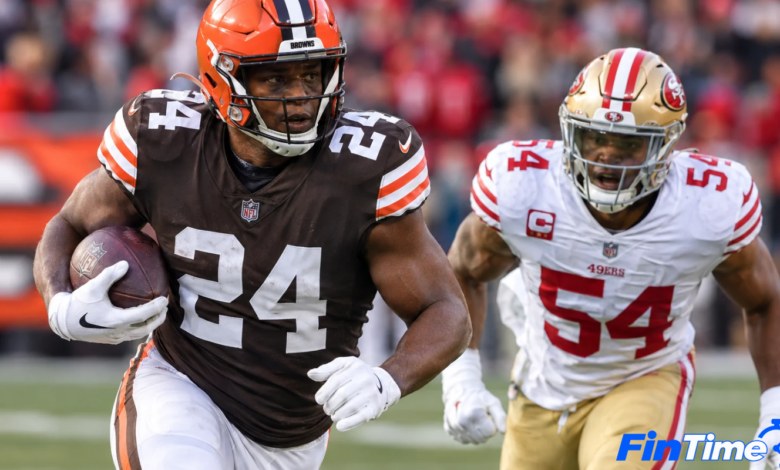
Cleveland Browns vs San Francisco 49ers: Match Score and Box Score
The 49ers defeated the Browns 26–8 on November 30, 2025, at Huntington Bank Field in Cleveland, Ohio. San Francisco improved its record to 9–4, while Cleveland fell to 3–9, according to the published game record. pro-football-reference.com+1
The final score tells only part of the story. Cleveland actually finished with 253 total net yards, one more than San Francisco’s 252. Yet the 49ers converted third downs far more efficiently, scored three touchdowns, and took advantage of Cleveland’s costly mistakes.
Final Score by Quarter
| Team | Q1 | Q2 | Q3 | Q4 | Final |
|---|---|---|---|---|---|
| San Francisco 49ers | 7 | 3 | 7 | 9 | 26 |
| Cleveland Browns | 0 | 8 | 0 | 0 | 8 |
San Francisco scored in every quarter. Cleveland’s only scoring came in the second quarter, when rookie tight end Harold Fannin Jr. caught a touchdown pass from quarterback Shedeur Sanders and running back Quinshon Judkins converted the two-point attempt.
The Browns were still within two points at halftime, trailing 10–8. However, they failed to score in the second half, while the 49ers added 16 points to secure the win.
More Read: Aitch Net Worth 2026: How the British Rapper Built His Wealth
Quarter-by-Quarter Game Recap
First Quarter: Christian McCaffrey Opens the Scoring
San Francisco established an early advantage when running back Christian McCaffrey scored on a one-yard rushing touchdown with 8:12 remaining in the first quarter. Kicker Matt Gay added the extra point to give the 49ers a 7–0 lead.
Cleveland’s opening-quarter offense could not match that scoring drive. San Francisco’s defense helped keep the Browns from turning their early possessions into points.
The touchdown also illustrated McCaffrey’s value near the goal line: even when a drive does not produce a long run, a short, successful carry can be decisive.
Second Quarter: Cleveland Responds, but San Francisco Leads at Half
The Browns produced their most productive scoring sequence late in the first half. Sanders connected with Fannin on a 34-yard touchdown pass with just 39 seconds remaining. Cleveland then used Judkins on the two-point conversion, bringing the score to 8–7 in its favor.
San Francisco responded before halftime. Gay converted a 25-yard field goal as time expired, restoring the 49ers’ lead at 10–8.
The sequence was important because Cleveland briefly moved in front but could not take that advantage into the break. San Francisco’s final possession of the half delivered three points and momentum.
Third Quarter: Brock Purdy Adds a Rushing Touchdown
The 49ers extended their lead in the third quarter. Brock Purdy ran the ball two yards into the end zone with 1:29 remaining, and Gay converted the extra point.
That made the score 17–8. Cleveland now needed a touchdown and a successful conversion simply to get within one point, but the offense struggled to sustain drives.
Fourth Quarter: Jennings and Gay Finish the Job
San Francisco increased its lead when Purdy threw a seven-yard touchdown pass to Jauan Jennings with 11:05 remaining. The 49ers attempted a passing conversion, but it failed, leaving the score at 23–8.
Gay then kicked a 31-yard field goal with 4:09 left. The final score was 26–8, sealing a comfortable road victory for San Francisco.
Cleveland Browns vs San Francisco 49ers Match Player Stats: Quarterbacks
The quarterback comparison is one of the most important parts of this matchup. Purdy and Sanders each threw for one touchdown and no interceptions, but San Francisco’s passing game proved more effective at converting opportunities into points.
Brock Purdy Player Stats
| Statistic | Brock Purdy |
|---|---|
| Completions/Attempts | 16/29 |
| Passing yards | 168 |
| Passing touchdowns | 1 |
| Interceptions | 0 |
| Passer rating | 83.7 |
| Rushing attempts | 2 |
| Rushing yards | 4 |
| Rushing touchdowns | 1 |
| Sacks taken | 1 |
Purdy finished with 168 passing yards and added a two-yard rushing touchdown. Although his passing numbers were not explosive, his ability to contribute on the ground gave the 49ers another scoring option.
He also avoided interceptions, allowing San Francisco to maintain possession and build scoring drives without giving Cleveland a takeaway through the air.
Shedeur Sanders Player Stats
| Statistic | Shedeur Sanders |
|---|---|
| Completions/Attempts | 16/25 |
| Passing yards | 149 |
| Passing touchdowns | 1 |
| Interceptions | 0 |
| Passer rating | 93.6 |
| Rushing attempts | 1 |
| Rushing yards | 6 |
| Sacks taken | 3 |
Sanders completed 16 of 25 passes for 149 yards and a touchdown, finishing with a higher passer rating than Purdy. His 34-yard scoring connection with Fannin was Cleveland’s defining offensive play.
However, Sanders was sacked three times for a combined loss of 34 yards. Those sacks reduced the value of Cleveland’s passing production and contributed to the challenge of sustaining drives. The Browns’ problem was not simply quarterback accuracy; it was the inability to turn enough possessions into points.
Quarterback Comparison: Who Had the Better Game?
Purdy produced more passing yards and contributed a rushing touchdown. Sanders recorded the higher passer rating and completed a slightly larger share of his attempts.
The distinction was overall impact. Purdy’s rushing score and touchdown pass helped the 49ers put 26 points on the board. Sanders produced a touchdown pass but did not get enough support from the offense to keep pace.
When evaluating quarterbacks, it is useful to consider more than passing yards or passer rating. Sacks, scoring plays, turnovers, third-down conversions, and the outcome of each drive help explain the difference between individual efficiency and team success.
Rushing Stats: Quinshon Judkins vs Christian McCaffrey
The ground game produced one of the most interesting statistical contrasts of the afternoon. Cleveland gained substantially more rushing yards, but San Francisco’s runners found the end zone twice.
Top Rushing Performers
| Player | Team | Carries | Rushing yards | Average | TDs |
|---|---|---|---|---|---|
| Quinshon Judkins | Browns | 23 | 91 | 4.0 | 0 |
| Christian McCaffrey | 49ers | 20 | 53 | 2.7 | 1 |
| Brian Robinson Jr. | 49ers | 8 | 26 | 3.3 | 0 |
| Dylan Sampson | Browns | 4 | 23 | 5.8 | 0 |
| Brock Purdy | 49ers | 2 | 4 | 2.0 | 1 |
Quinshon Judkins Leads Cleveland’s Ground Attack
Judkins was Cleveland’s leading rusher, recording 91 yards on 23 carries. His four-yards-per-carry average showed that the Browns could make progress on the ground, even though they struggled to convert that production into touchdowns.
Sampson added 23 yards on four attempts. Together, their contributions helped Cleveland finish with 138 rushing yards, compared with San Francisco’s 91.
The limitation was scoring. Cleveland did not record a rushing touchdown, while San Francisco scored twice on the ground.
Christian McCaffrey Contributes at the Goal Line
McCaffrey gained 53 yards on 20 carries and scored the game’s opening touchdown. He also caught four passes for 21 yards, giving him 74 combined rushing and receiving yards.
His rushing average was lower than Judkins’, but touchdowns can matter more than average yardage in a game where scoring opportunities are limited. Purdy’s rushing touchdown also helped the 49ers turn their ground game into points.
Key takeaway: Cleveland won the rushing-yardage comparison, but San Francisco won the more important scoring comparison.
Receiving Stats: George Kittle and Harold Fannin Jr. Stand Out
The receiving statistics highlight two players who made a major impact despite their teams having very different outcomes.
Top Receiving Performers
| Player | Team | Receptions | Receiving yards | Longest catch | TDs |
|---|---|---|---|---|---|
| George Kittle | 49ers | 4 | 67 | 33 yards | 0 |
| Jauan Jennings | 49ers | 4 | 39 | 13 yards | 1 |
| Christian McCaffrey | 49ers | 4 | 21 | 12 yards | 0 |
| Kyle Juszczyk | 49ers | 2 | 27 | 23 yards | 0 |
| Harold Fannin Jr. | Browns | 3 | 43 | 34 yards | 1 |
| Jerry Jeudy | Browns | 3 | 26 | 11 yards | 0 |
| Gage Larvadain | Browns | 2 | 23 | 13 yards | 0 |
| Quinshon Judkins | Browns | 3 | 18 | 13 yards | 0 |
George Kittle Leads San Francisco in Receiving Yards
Kittle caught four passes for 67 yards, averaging 16.8 yards per reception. His longest catch covered 33 yards, making him the 49ers’ leading receiver by yardage.
Kittle’s production helped San Francisco move the ball through the air without requiring Purdy to attempt an exceptionally high volume of passes. Jennings also delivered a decisive contribution, catching four passes for 39 yards and scoring the fourth-quarter touchdown.
Harold Fannin Jr. Provides Cleveland’s Biggest Highlight
Fannin caught three passes for 43 yards, including the 34-yard touchdown from Sanders. That reception accounted for most of his receiving yardage and represented Cleveland’s only touchdown of the game.
Jeudy added three receptions for 26 yards, while Larvadain recorded two catches for 23 yards. Those contributions gave Cleveland several productive receiving options, but the offense could not build on them consistently.
The contrast illustrates why a long reception can be exciting without necessarily translating into a successful offensive performance. The timing of the catch, the next possession, and the team’s ability to repeat the production are equally important.
Team Statistics: Why the 49ers Won
The team numbers reveal that the Browns did not lose simply because they could not gain yards. Their biggest problems involved efficiency, lost fumbles, and converting possessions into points.
| Team statistic | 49ers | Browns |
|---|---|---|
| Total net yards | 252 | 253 |
| First downs | 19 | 15 |
| Passing yards, net | 161 | 115 |
| Rushing yards | 91 | 138 |
| Third-down conversions | 11/17 | 3/11 |
| Fourth-down conversions | 0/0 | 0/4 |
| Turnovers lost through fumbles | 0 | 2 |
| Time of possession | 30:10 | 29:50 |
| Final score | 26 | 8 |
Third-Down Efficiency Made a Major Difference
San Francisco converted 11 of 17 third-down attempts, a success rate of approximately 64.7%. Cleveland converted only three of 11, or 27.3%.
That gap meant the 49ers were much better at keeping drives alive. Even with almost identical total yardage, San Francisco created more opportunities to score.
Turnovers Hurt the Browns
The official game summary recorded four Browns fumbles, with two lost. The 49ers did not lose a fumble. Cleveland’s ball-security issues made it harder to sustain momentum and gave San Francisco opportunities to control the game.
Cleveland’s Fourth-Down Attempts Did Not Pay Off
The Browns went 0-for-4 on fourth down. A failed fourth-down attempt does not automatically mean the decision was wrong, since field position, time remaining, and the distance required all matter. But failing on all four attempts meant Cleveland could not convert those high-pressure situations into continued drives.
For anyone analysing the game, this is a useful reminder: total yards show how much ground a team gained, while conversion rates and turnovers help explain whether that production became points.
Defensive Performance and Special Teams
The 49ers’ defence helped preserve the lead by limiting Cleveland to eight points and recording three sacks. The Browns’ defence also produced pressure, including a sack by Myles Garrett, but it could not stop San Francisco from scoring in the second half.
Special teams also made a measurable difference. San Francisco’s Skyy Moore returned three punts for 69 yards, including a long return of 66 yards. Cleveland returned three punts for just three yards. Field-position advantages like these can influence how far an offence must travel to score.
Matt Gay converted two field goals, from 25 and 31 yards, and made two extra points. Those kicks added five points beyond San Francisco’s three touchdowns and helped turn sustained drives into a comfortable final margin.
How to Analyse NFL Player Stats Like an Expert
If you are comparing the Cleveland Browns vs San Francisco 49ers match player stats for fantasy football, sports writing, or general analysis, use these practical steps.
- Start with the official box score. Confirm the date, final score, and individual player totals before publishing or sharing a statistic.
- Compare volume and efficiency. Carries, targets, completions, and yards per attempt help explain how players generated their totals.
- Separate individual performance from the result. Judkins gained 91 rushing yards, but Cleveland still lost by 18 points.
- Check scoring and turnovers. Touchdowns and lost fumbles often explain more about a result than total yardage alone.
- Consider the game situation. A late touchdown when a team is behind by several scores may not have the same impact as an early score that changes momentum.
- Use context for fantasy football. Receptions, targets, red-zone opportunities, and rushing attempts can be useful, but a single game should not be treated as a reliable prediction of future performance.
For writers and sports bloggers, it is especially important to distinguish official statistics from interpretation. A box score can confirm what happened; explaining why it mattered requires context.
Conclusion
The Cleveland Browns vs San Francisco 49ers match player stats from November 30, 2025, tell the story of a 26–8 San Francisco victory built on scoring efficiency, successful third-down conversions, and better ball security. Brock Purdy threw for 168 yards and scored a rushing touchdown, Christian McCaffrey added a rushing score, and George Kittle led the 49ers with 67 receiving yards.
Cleveland had some bright spots. Quinshon Judkins rushed for 91 yards, Shedeur Sanders threw for 149 yards and a touchdown, and Harold Fannin Jr. delivered the Browns’ most memorable play with a 34-yard scoring reception. Yet Cleveland’s 0-for-4 fourth-down record, two lost fumbles, and inability to score after halftime proved costly.
The most revealing statistic may be the total-yardage comparison: Cleveland gained 253 net yards to San Francisco’s 252, but the 49ers won by 18 points. It is a clear example of why NFL results depend not just on moving the ball, but on converting opportunities into points and protecting possession.
FAQs
1. What was the final score of Browns vs 49ers on November 30, 2025?
The San Francisco 49ers defeated the Cleveland Browns 26–8 at Huntington Bank Field in Cleveland.
2. How many passing yards did Brock Purdy have?
Purdy completed 16 of 29 passes for 168 yards, one passing touchdown, and no interceptions. He also rushed for a two-yard touchdown.
3. How did Shedeur Sanders perform against the 49ers?
Sanders completed 16 of 25 passes for 149 yards and one touchdown, with no interceptions. He was sacked three times for a combined loss of 34 yards.
4. Who was the leading rusher in the game?
Cleveland’s Quinshon Judkins led all players with 91 rushing yards on 23 carries. Christian McCaffrey led San Francisco with 53 rushing yards and one touchdown.


One Comment